Research Methods

Participants sorted items related to travel. This enabled our team to pivot our direction towards a service that helped travelers get unique items from specific regions.
I created this decision-making stimulus activity where users were presented choices in a travel scenario.
We shadowed seniors in their daily lives to understand their activities, values and needs. We later interviewed them.
I've conducted interviews in a variety of contexts and industries including hospitality, retail, healthcare and transportation. I've used a range of interview strategies, from meticulously crafted interview protocols to a few open-ended questions.

For a research project on measuring control in a ping pong match, we used a Microsoft Kinect camera to track center of mass and accelerometers to measure paddle movement and hit strength.

I mapped ping-pong player movements based on a tracking program using Microsoft Kinect cameras and compared movement with hit strength as measured by accelerometers attached to each player's paddle.

Participants brought meaningful objects that they purchased on trips. Those objects helped guide our interviews and further define our service offering.

We asked several types of travelers to document their packing experience through photos, which guided later interviews.

I attempted to locate a glass octopus in Italy that a friend wish she would've bought on a vacation, which is what helped inspire a project. I wasn't successful, which gave insight to the service need.


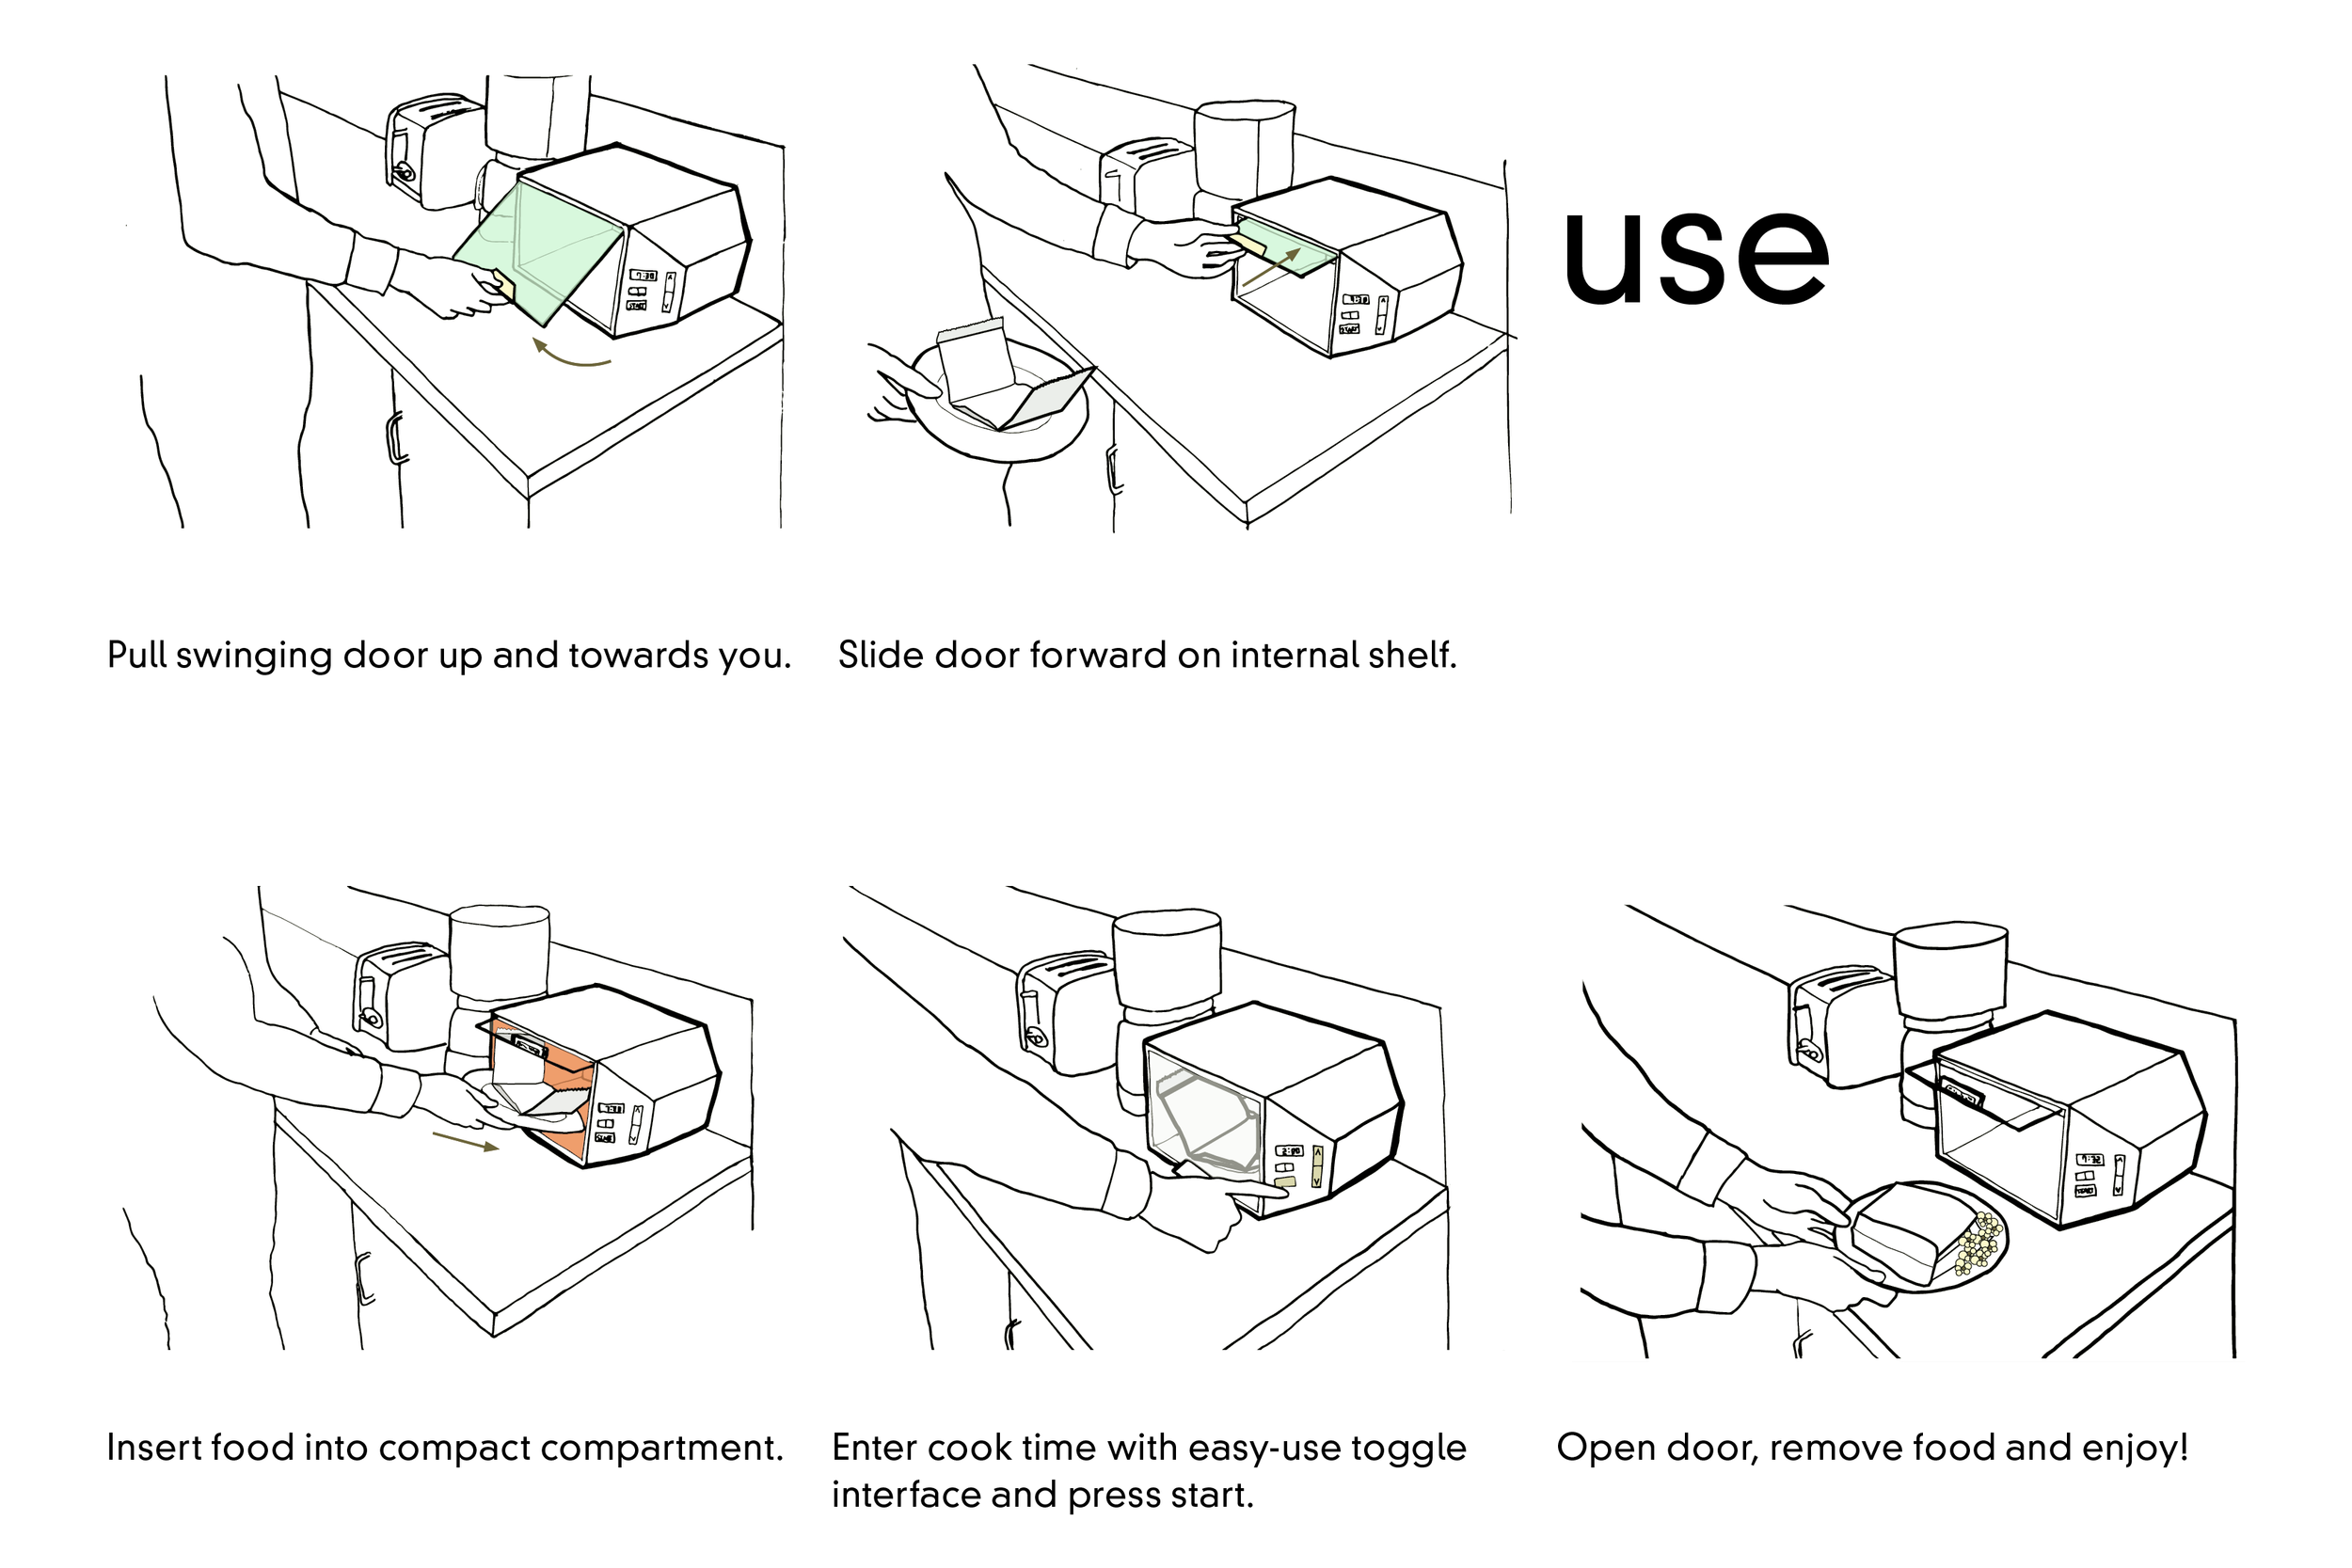
Communicating Results

I used 3D objects to express twitter sentiment about airlines compared with actual airport delays in three cities. This twitter egg and nest represent Los Angeles in February 2015.

This visual represents twitter sentiment of Los Angeles passengers for one week in February 2015. Nest volume represents the total number of delay minutes and the white fins represent tweet types. More positive tweets means a healthier egg, or a more positive sentiment. Negative tweets make the egg contract.

I developed skills in CSS, HTML5, JavaScript and JQuery to produce a geographic representations of tweets by sentiment. Click to view the visualization.

I created a video to share the benefits of bellwether, a digital platform that connects people with the ones they trust the most for the best recommendations. Using what I learned from this process, I produced another video about transportation trends during my internship at Goodyear (video confidential).

I made recommendations to improve features on an existing app. Improvements included podcast rankings based on completion %, a subscription screen with less clutter, and a moveable widget that allows you to browse while listening.

This diagram was based on research about patients with COPD, a chronic respiratory illness, and how they manage their symptoms by using their inhalers.

I documented a problematic pedestrian crossing and used line drawings to compare it with the wild west.

I developed hand-sketching skills to show how to use a microwave concept I created in a product design course.


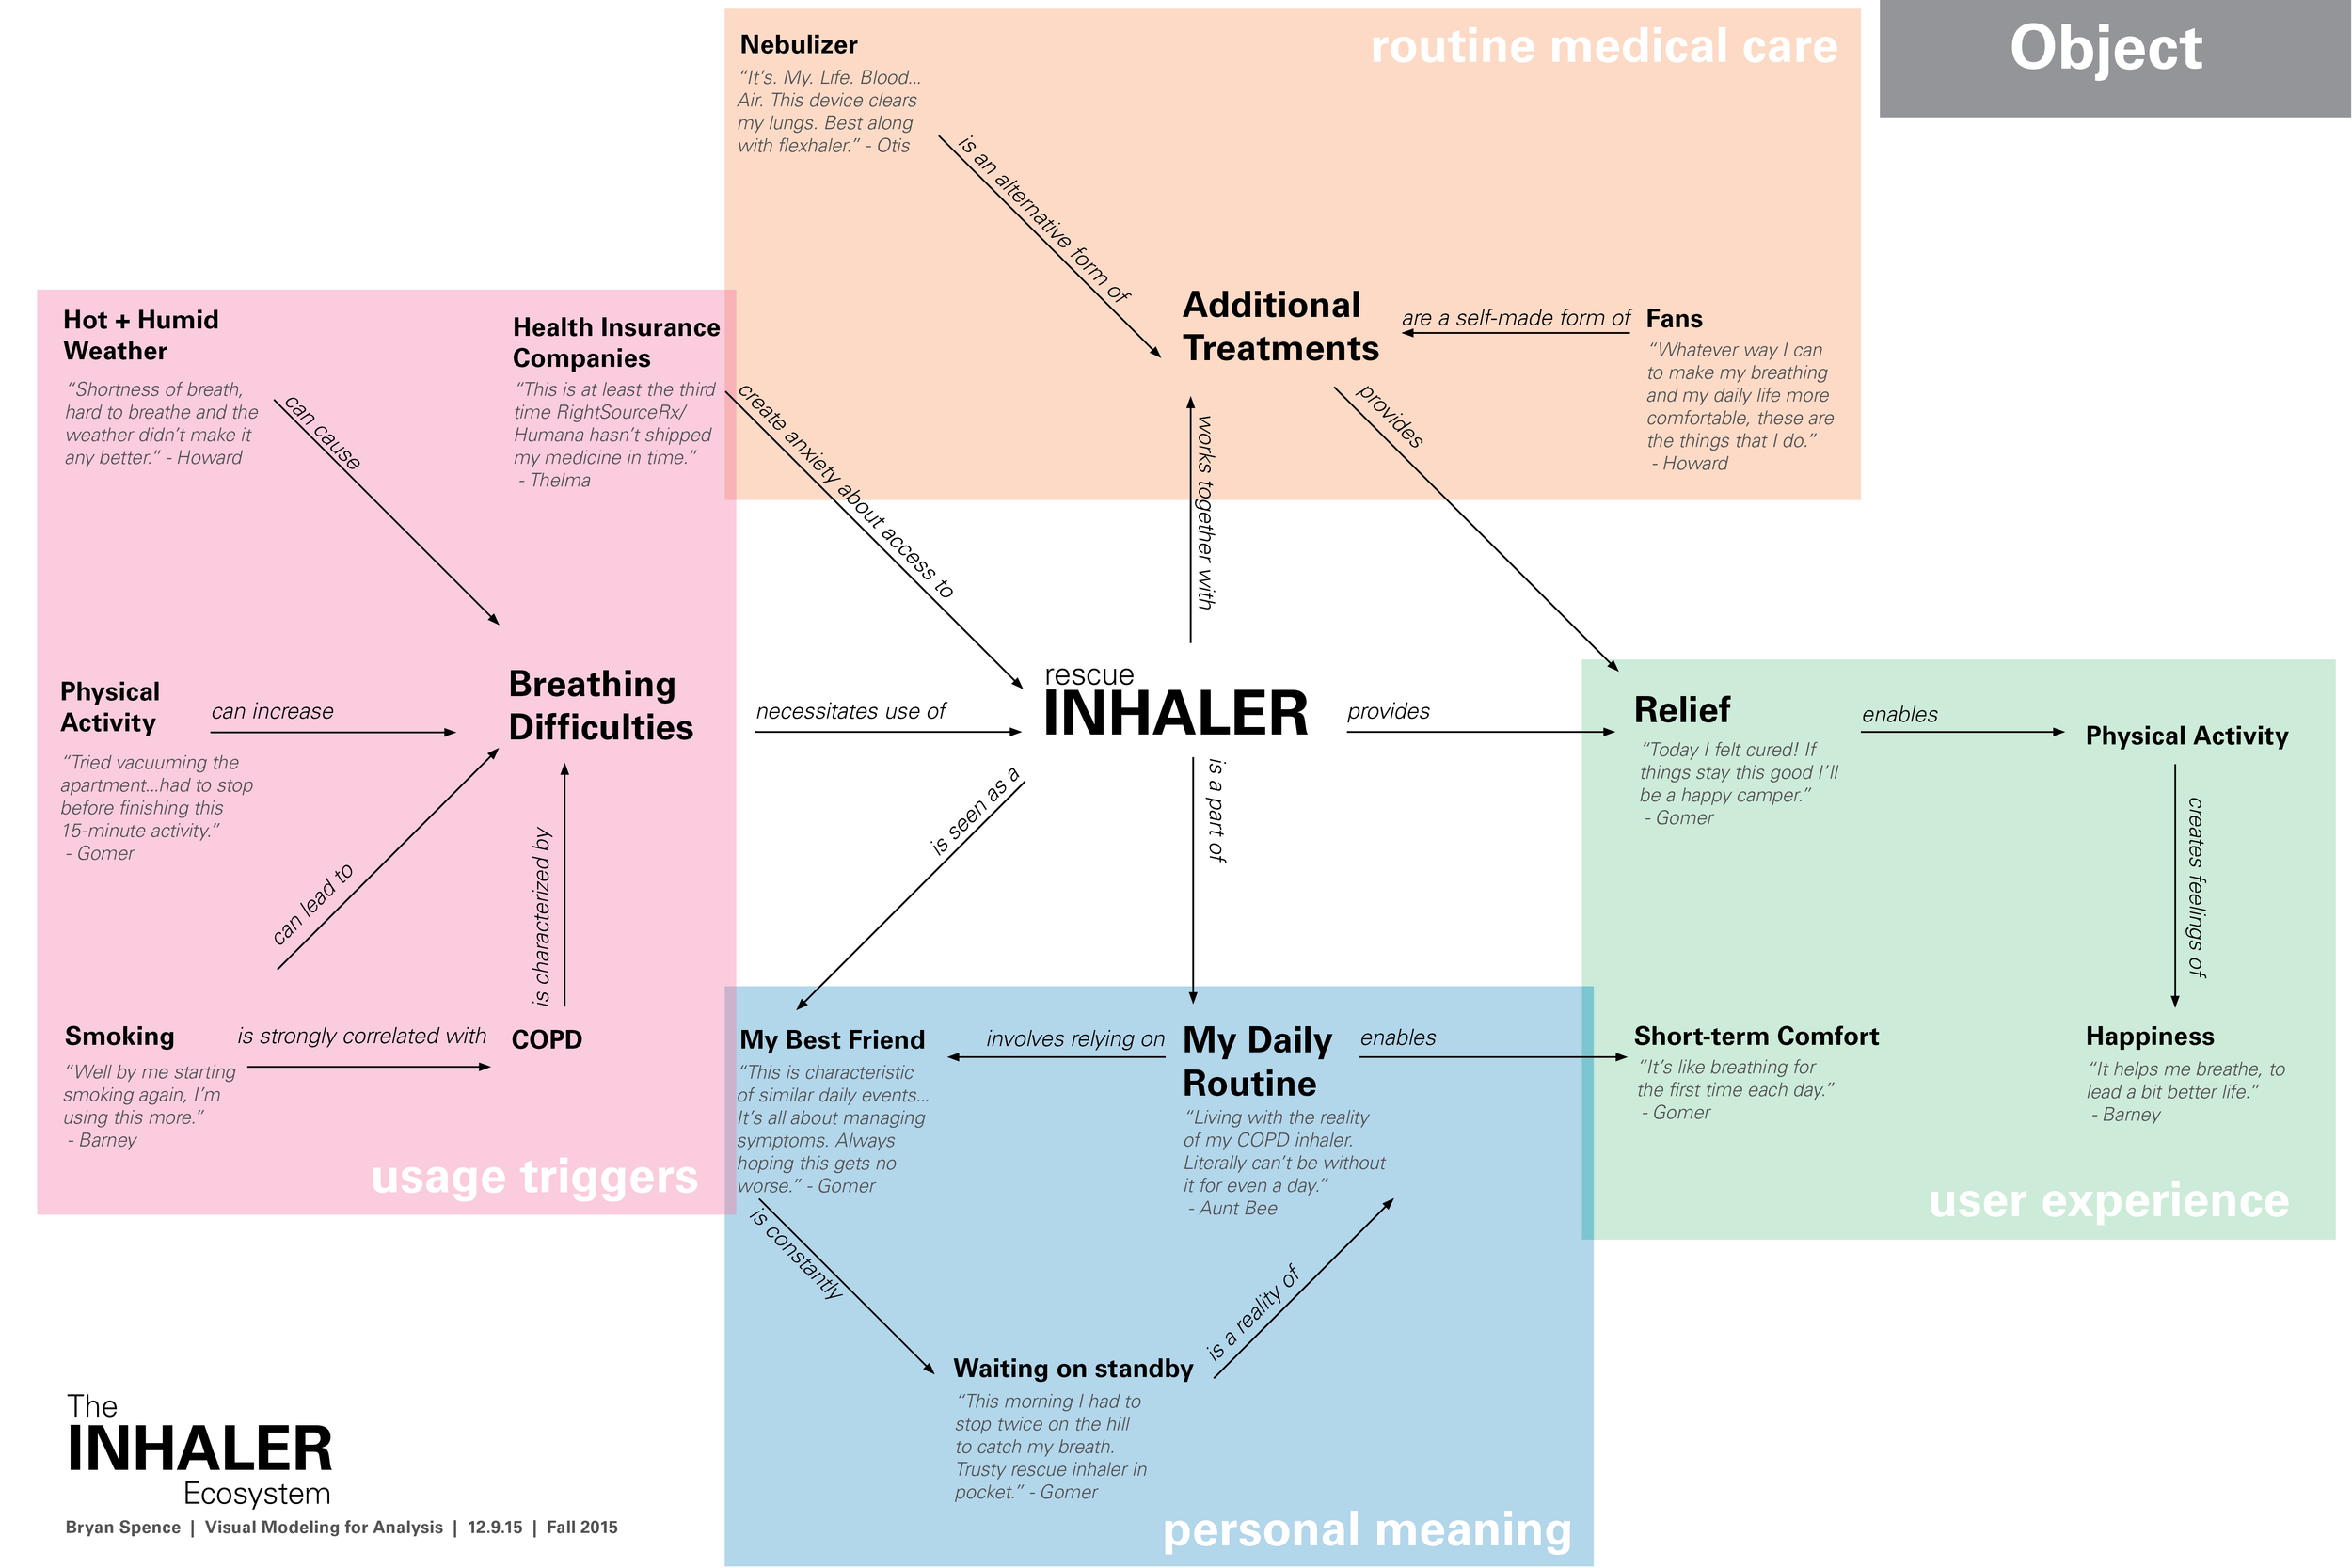
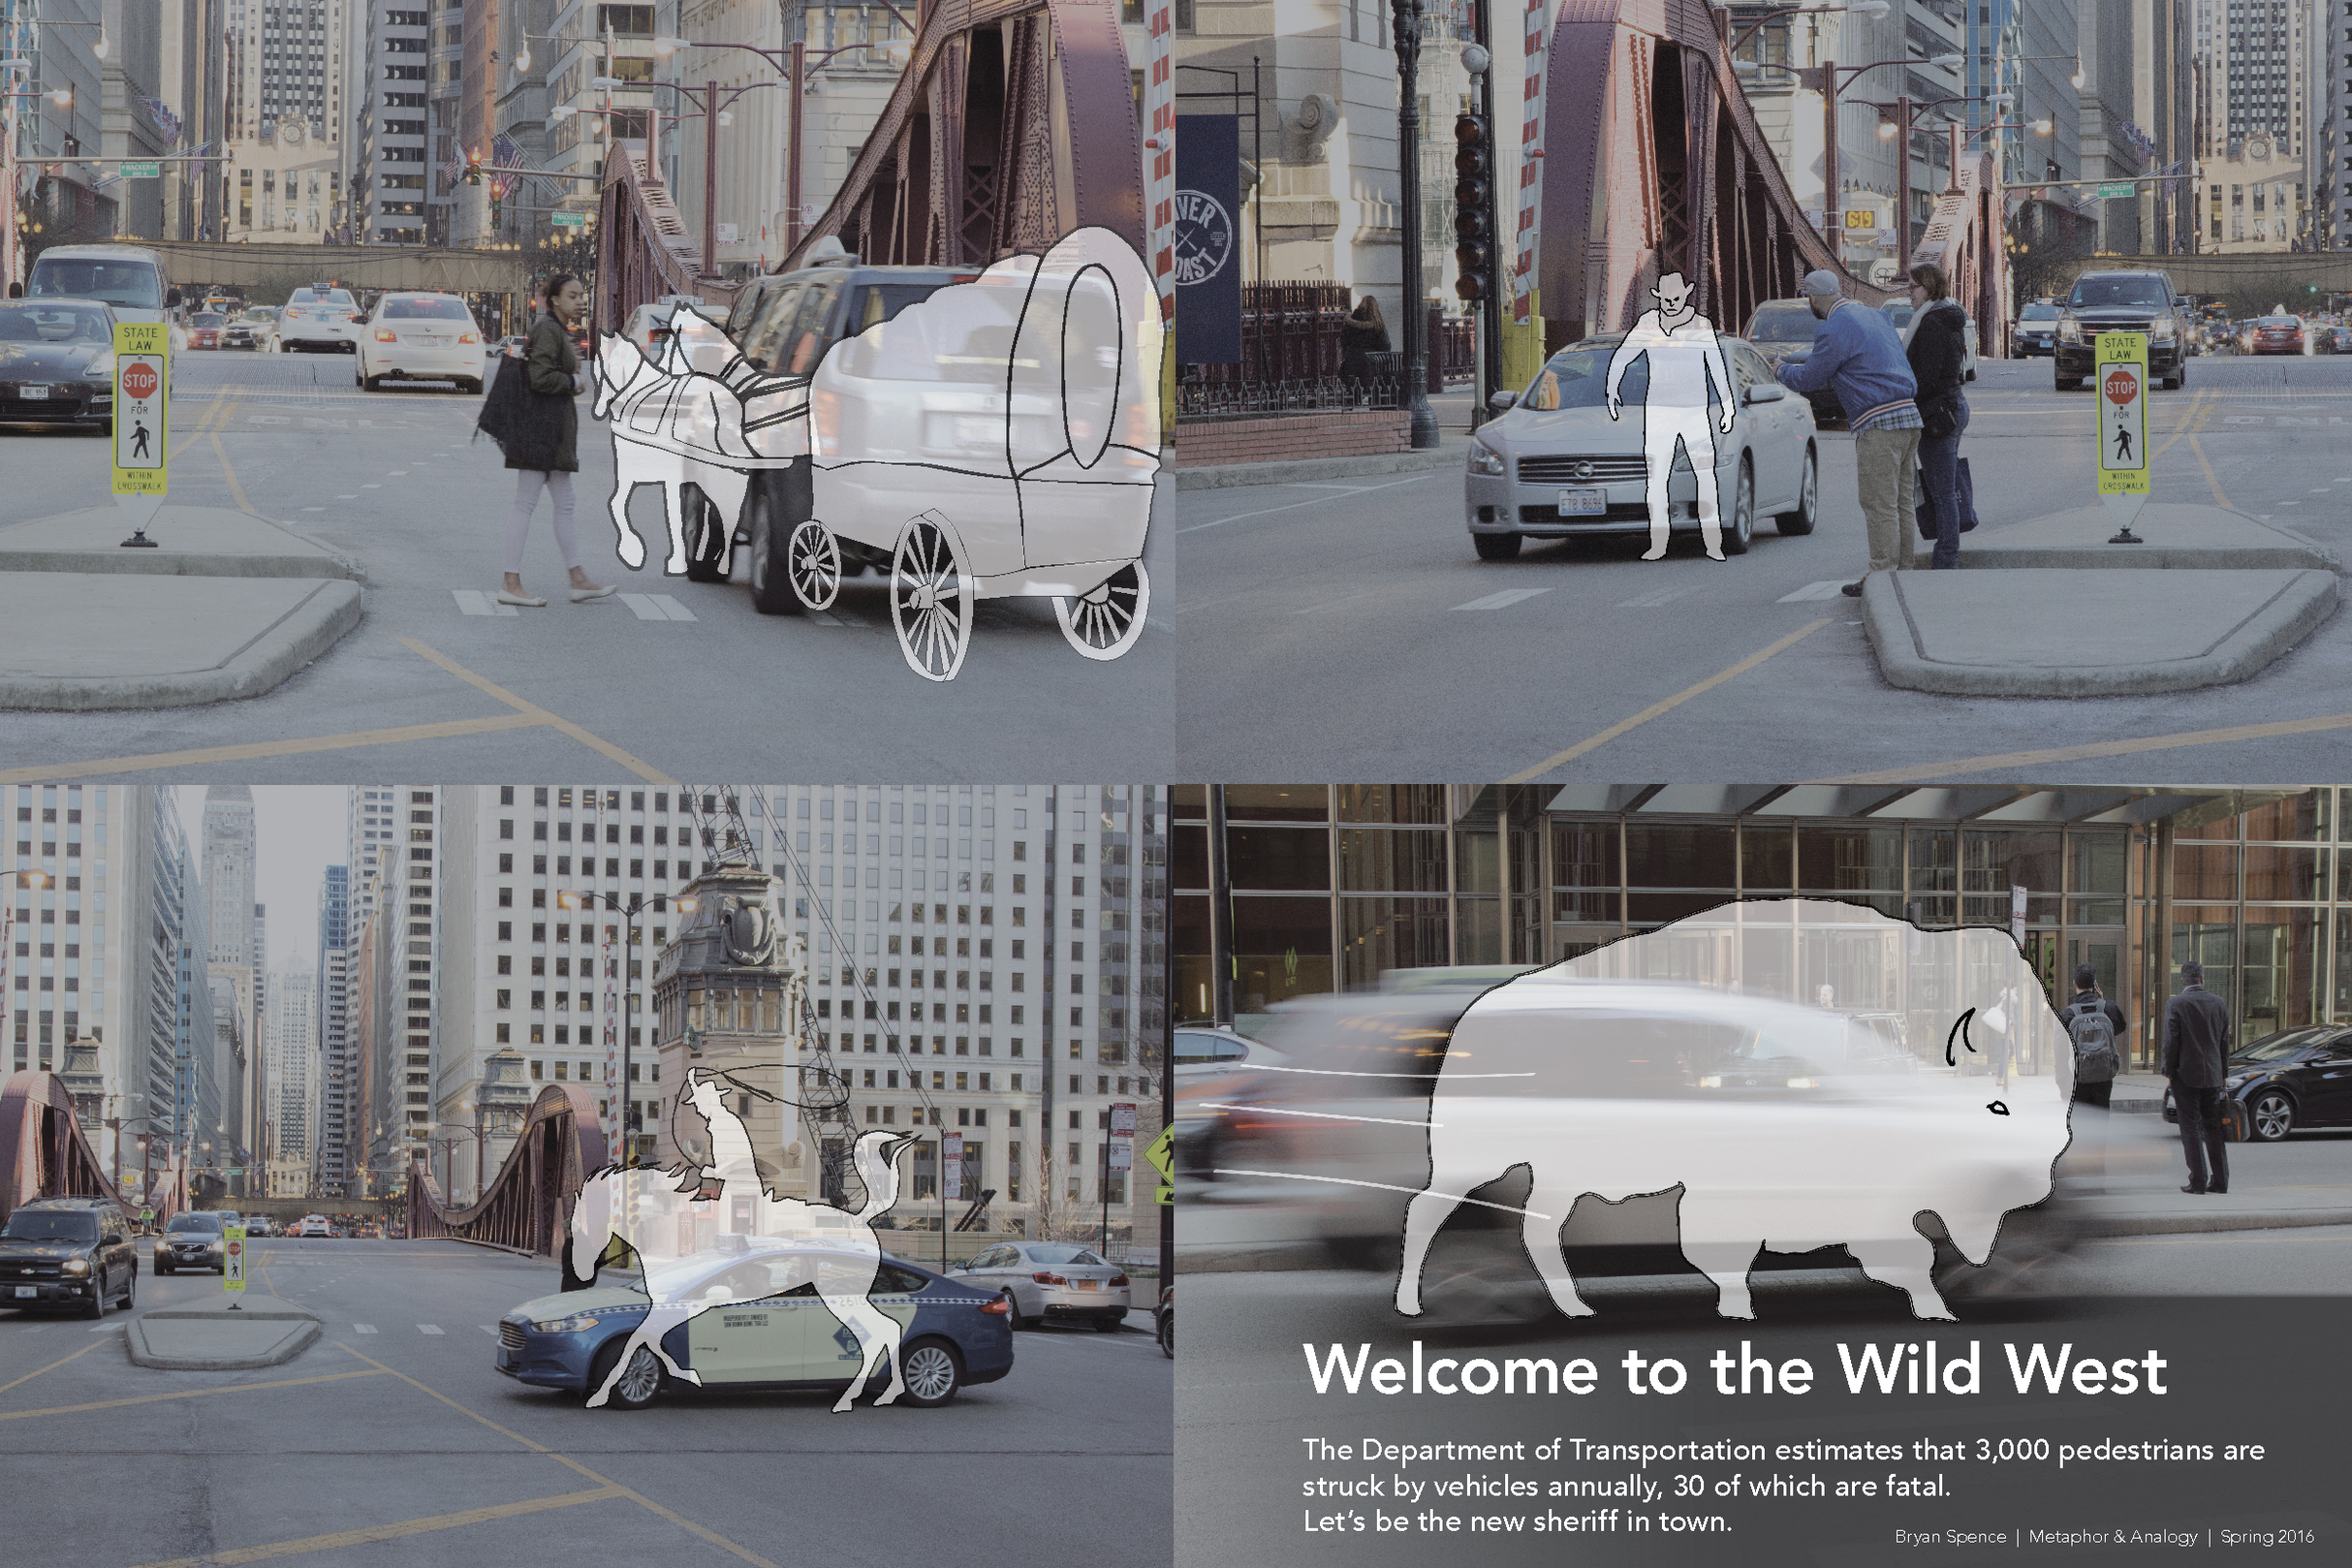
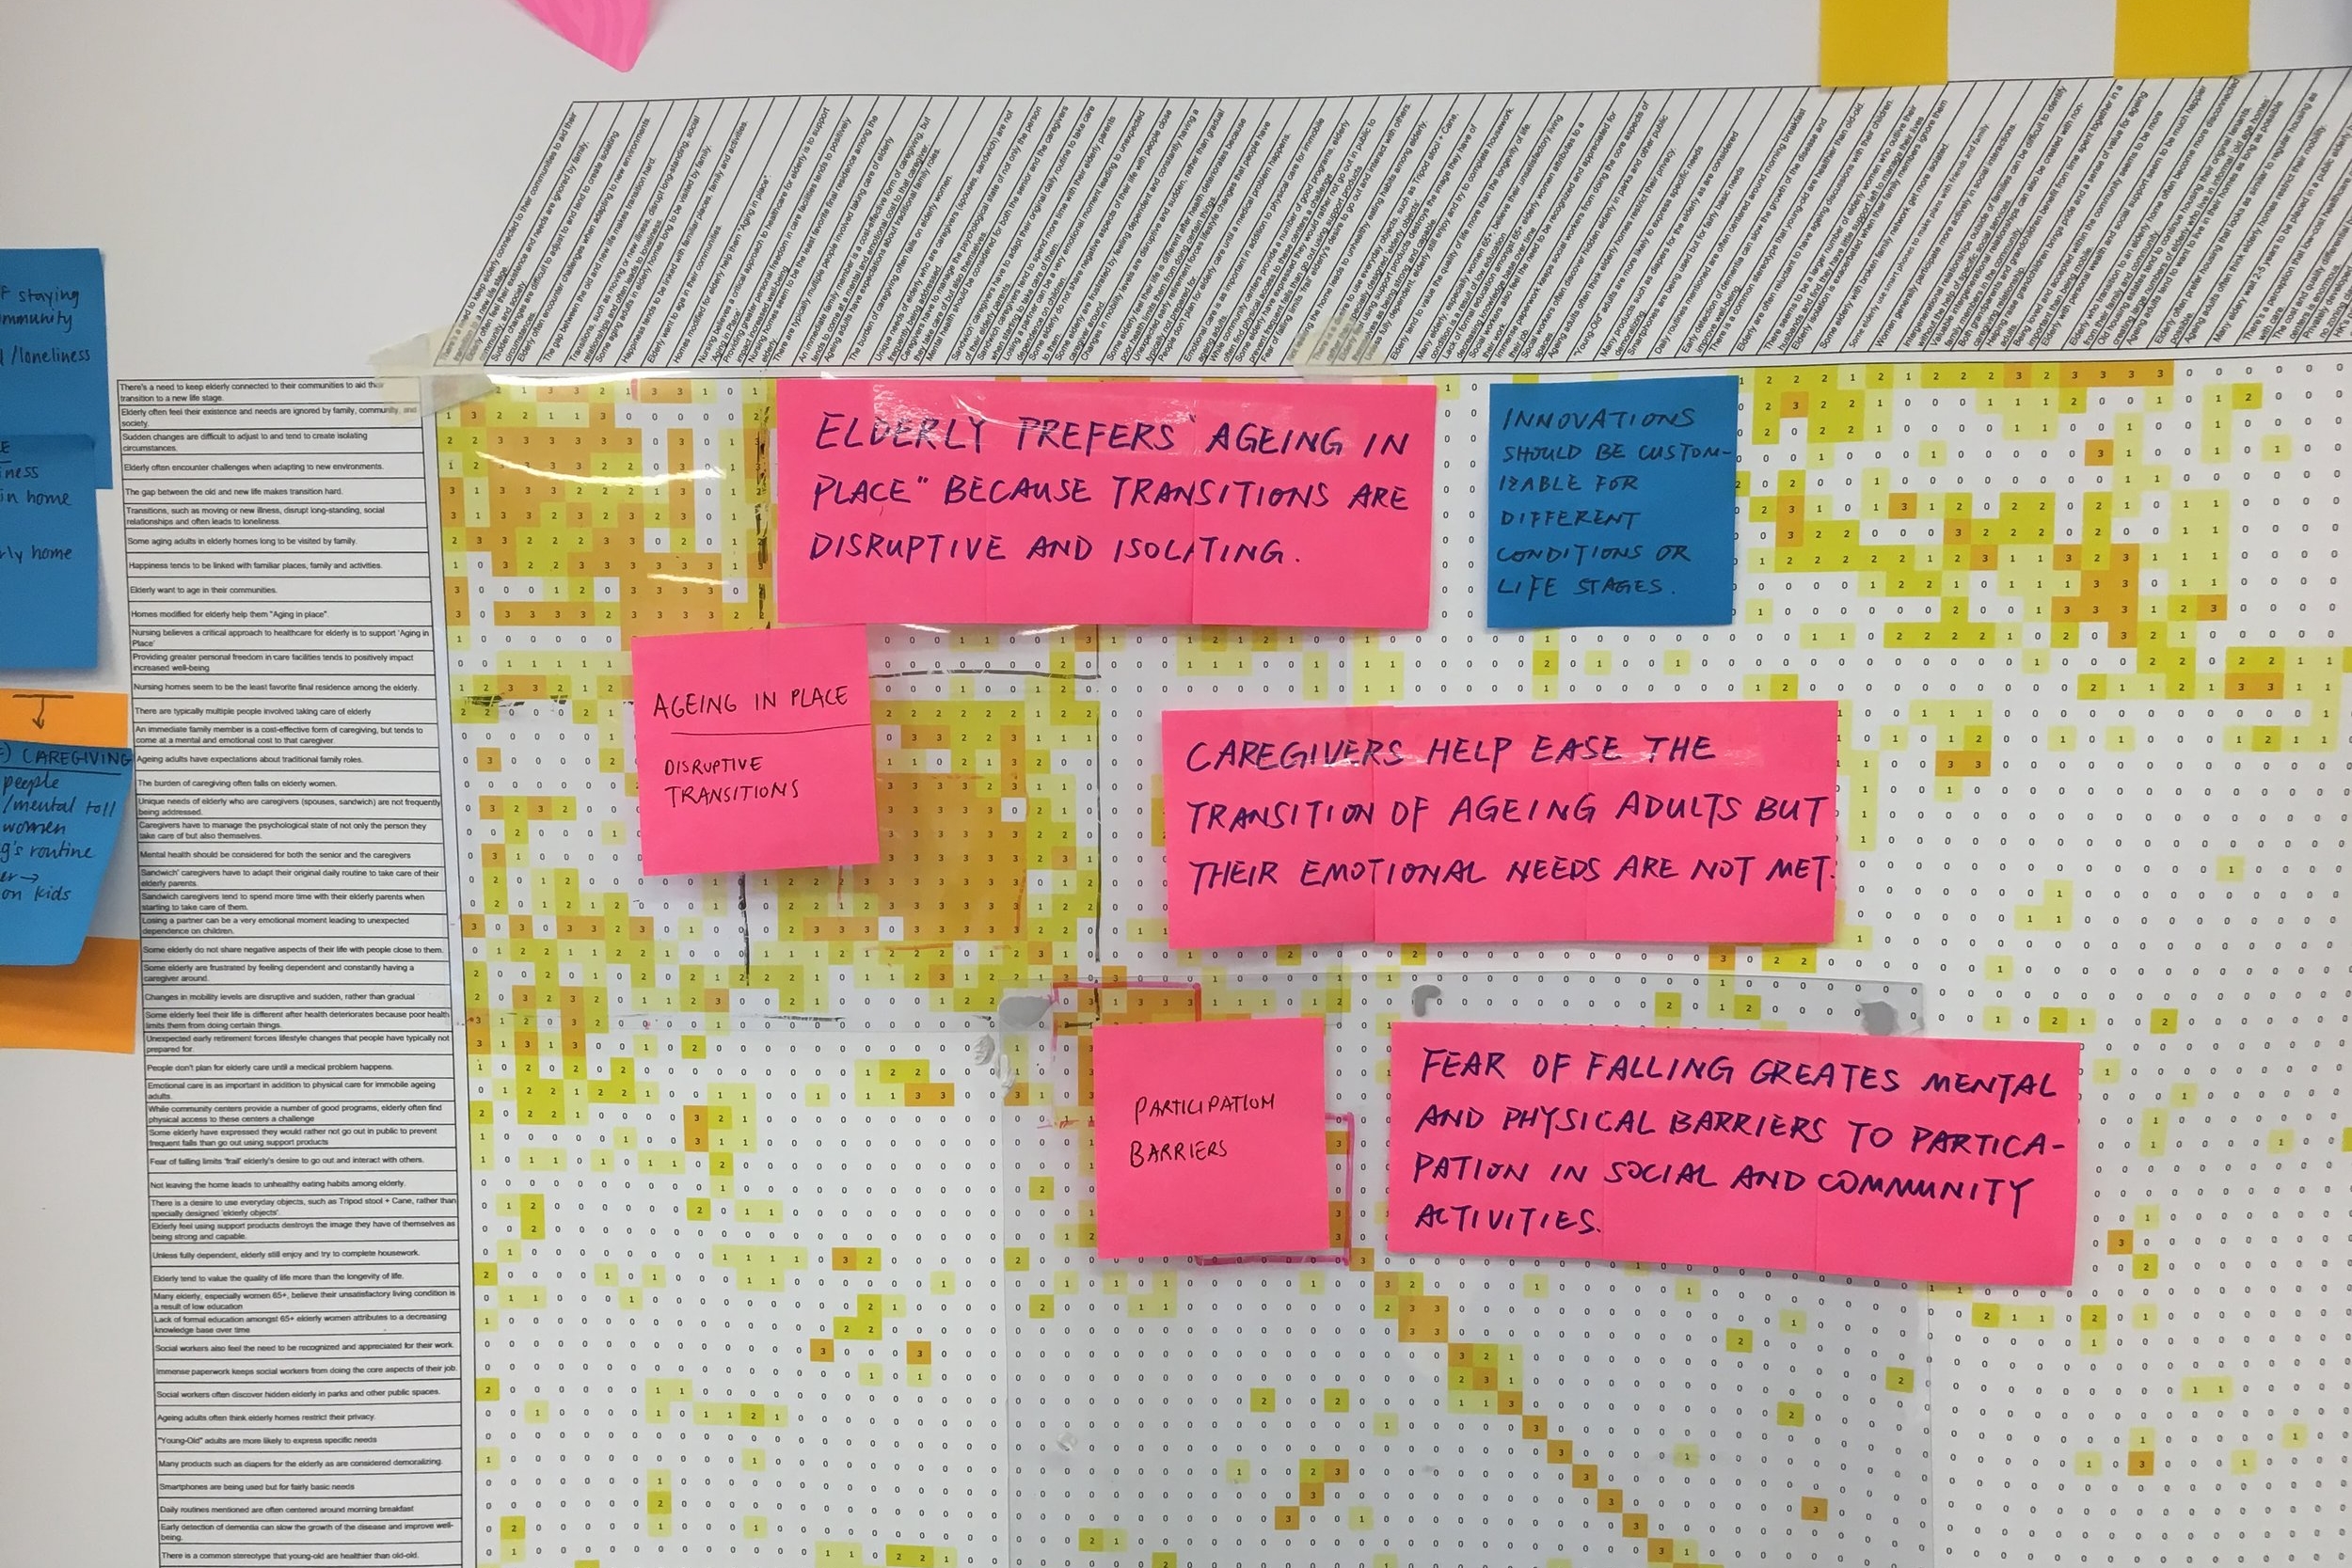
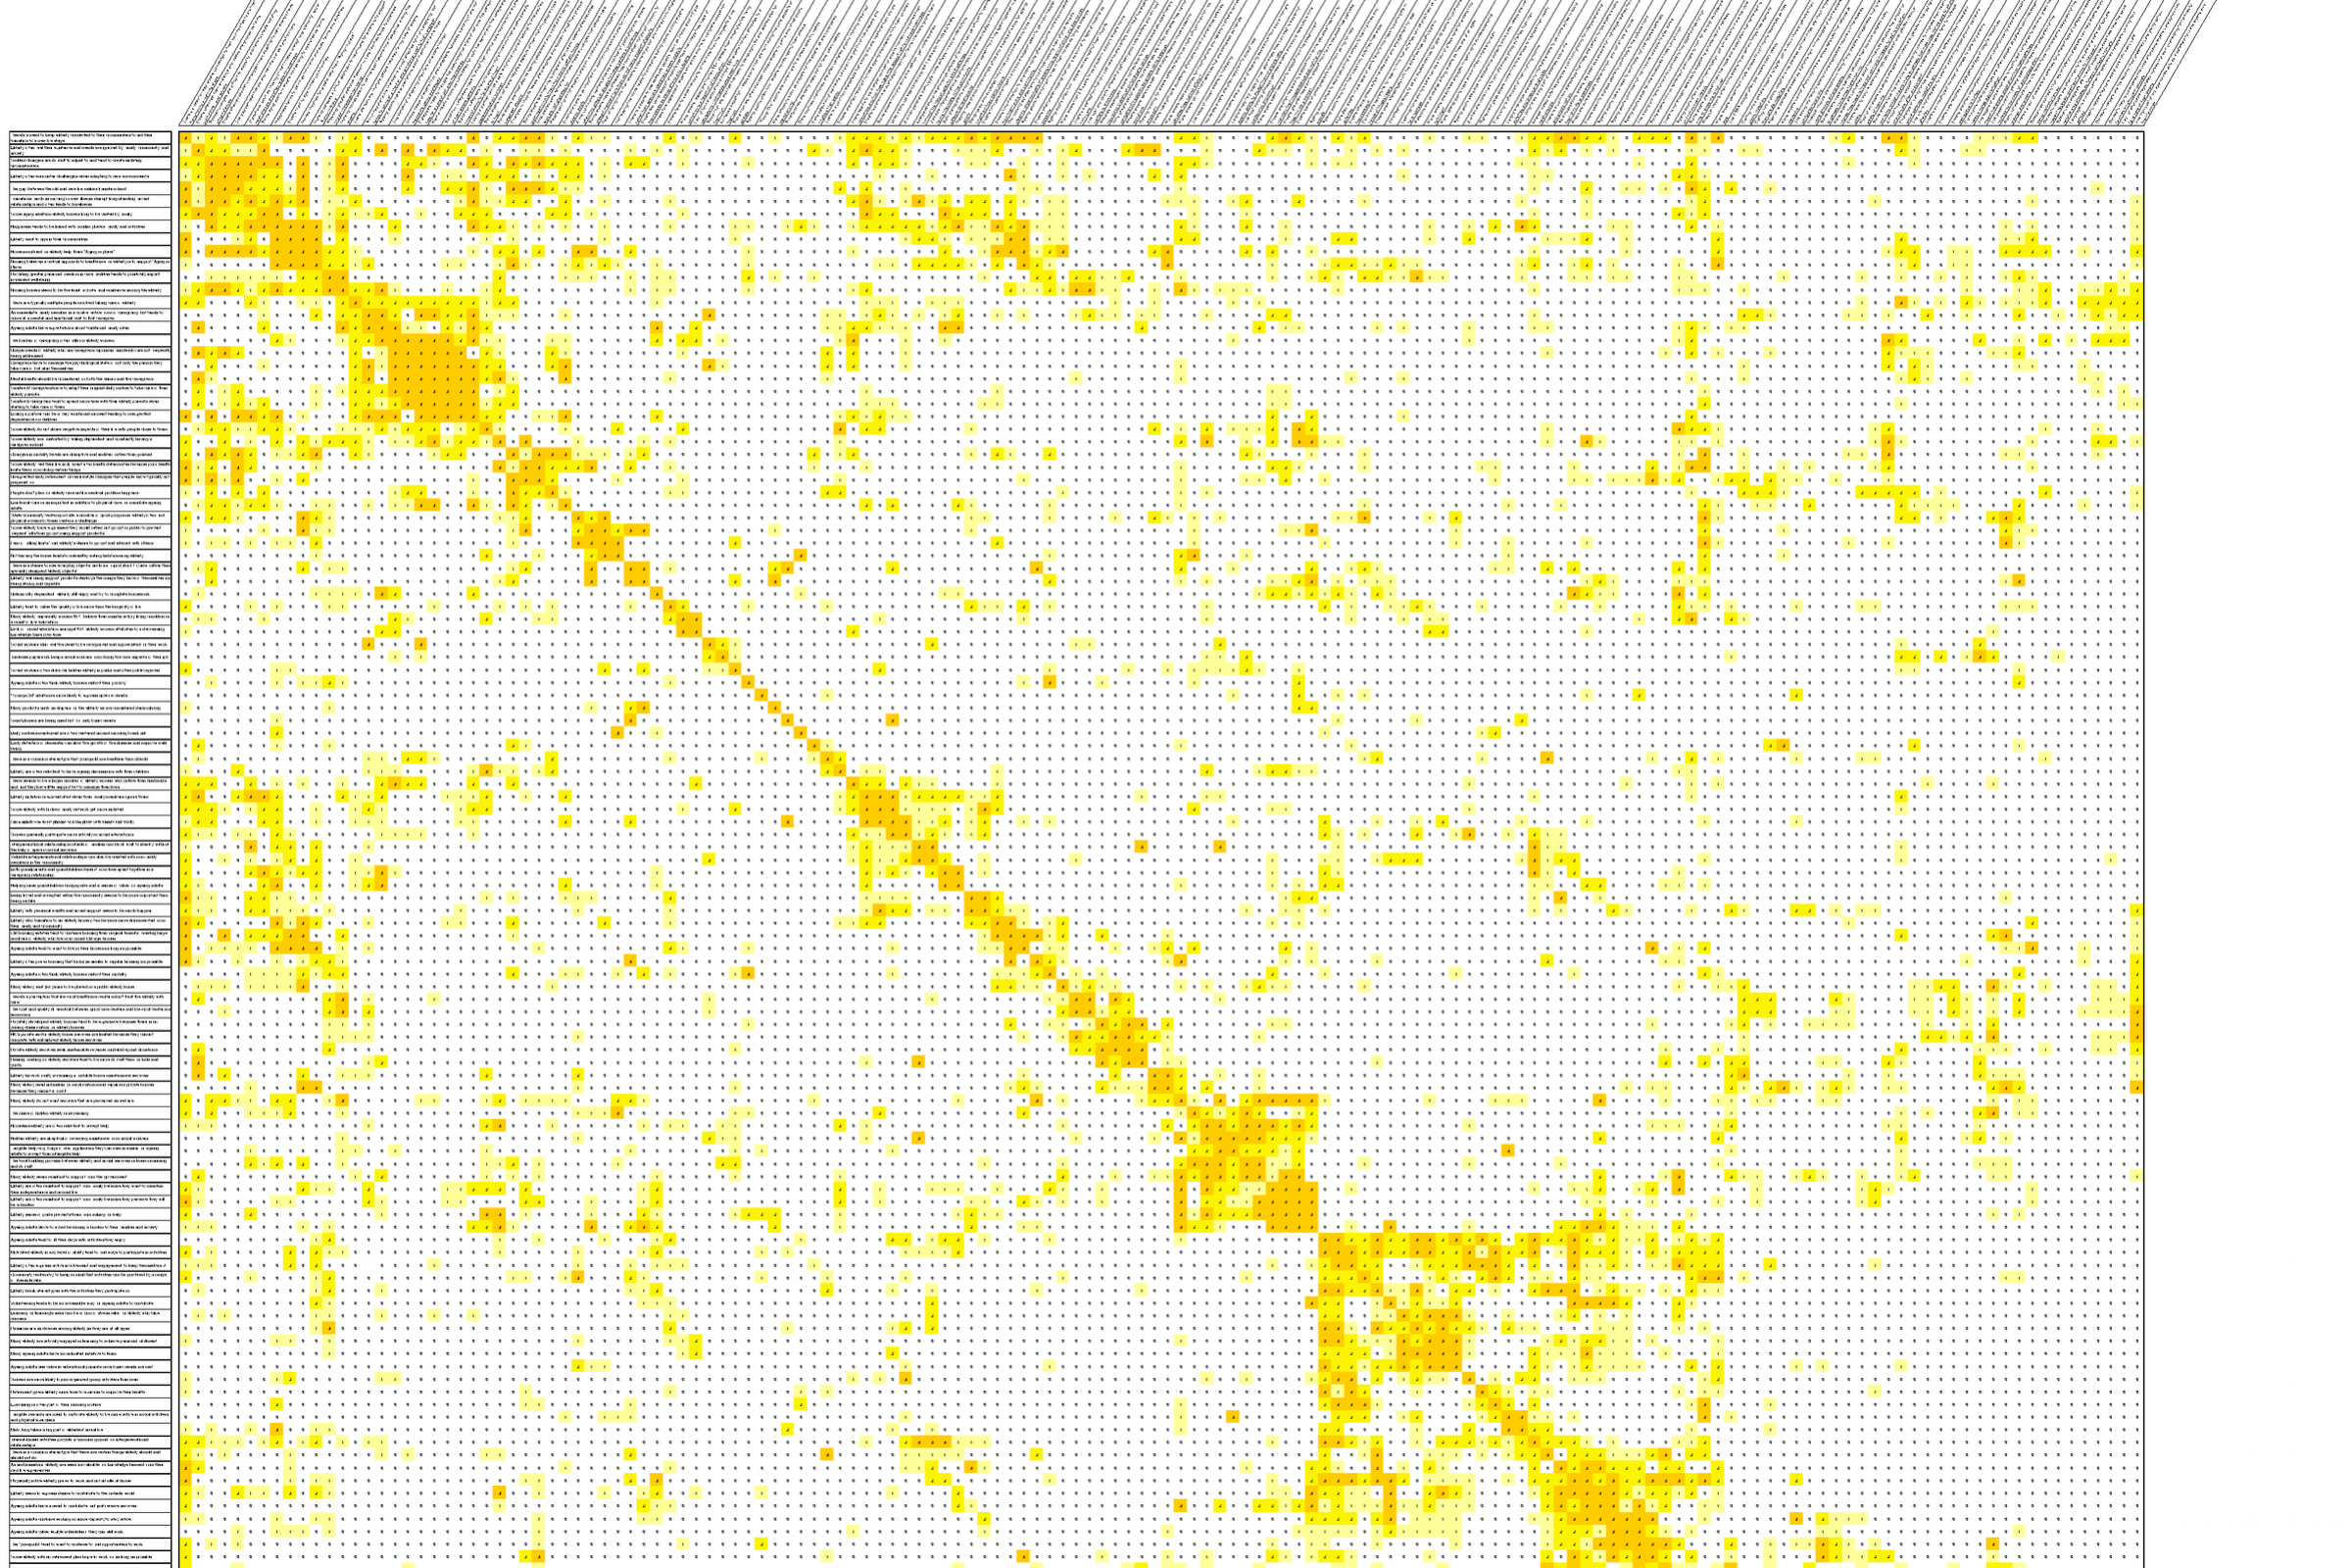
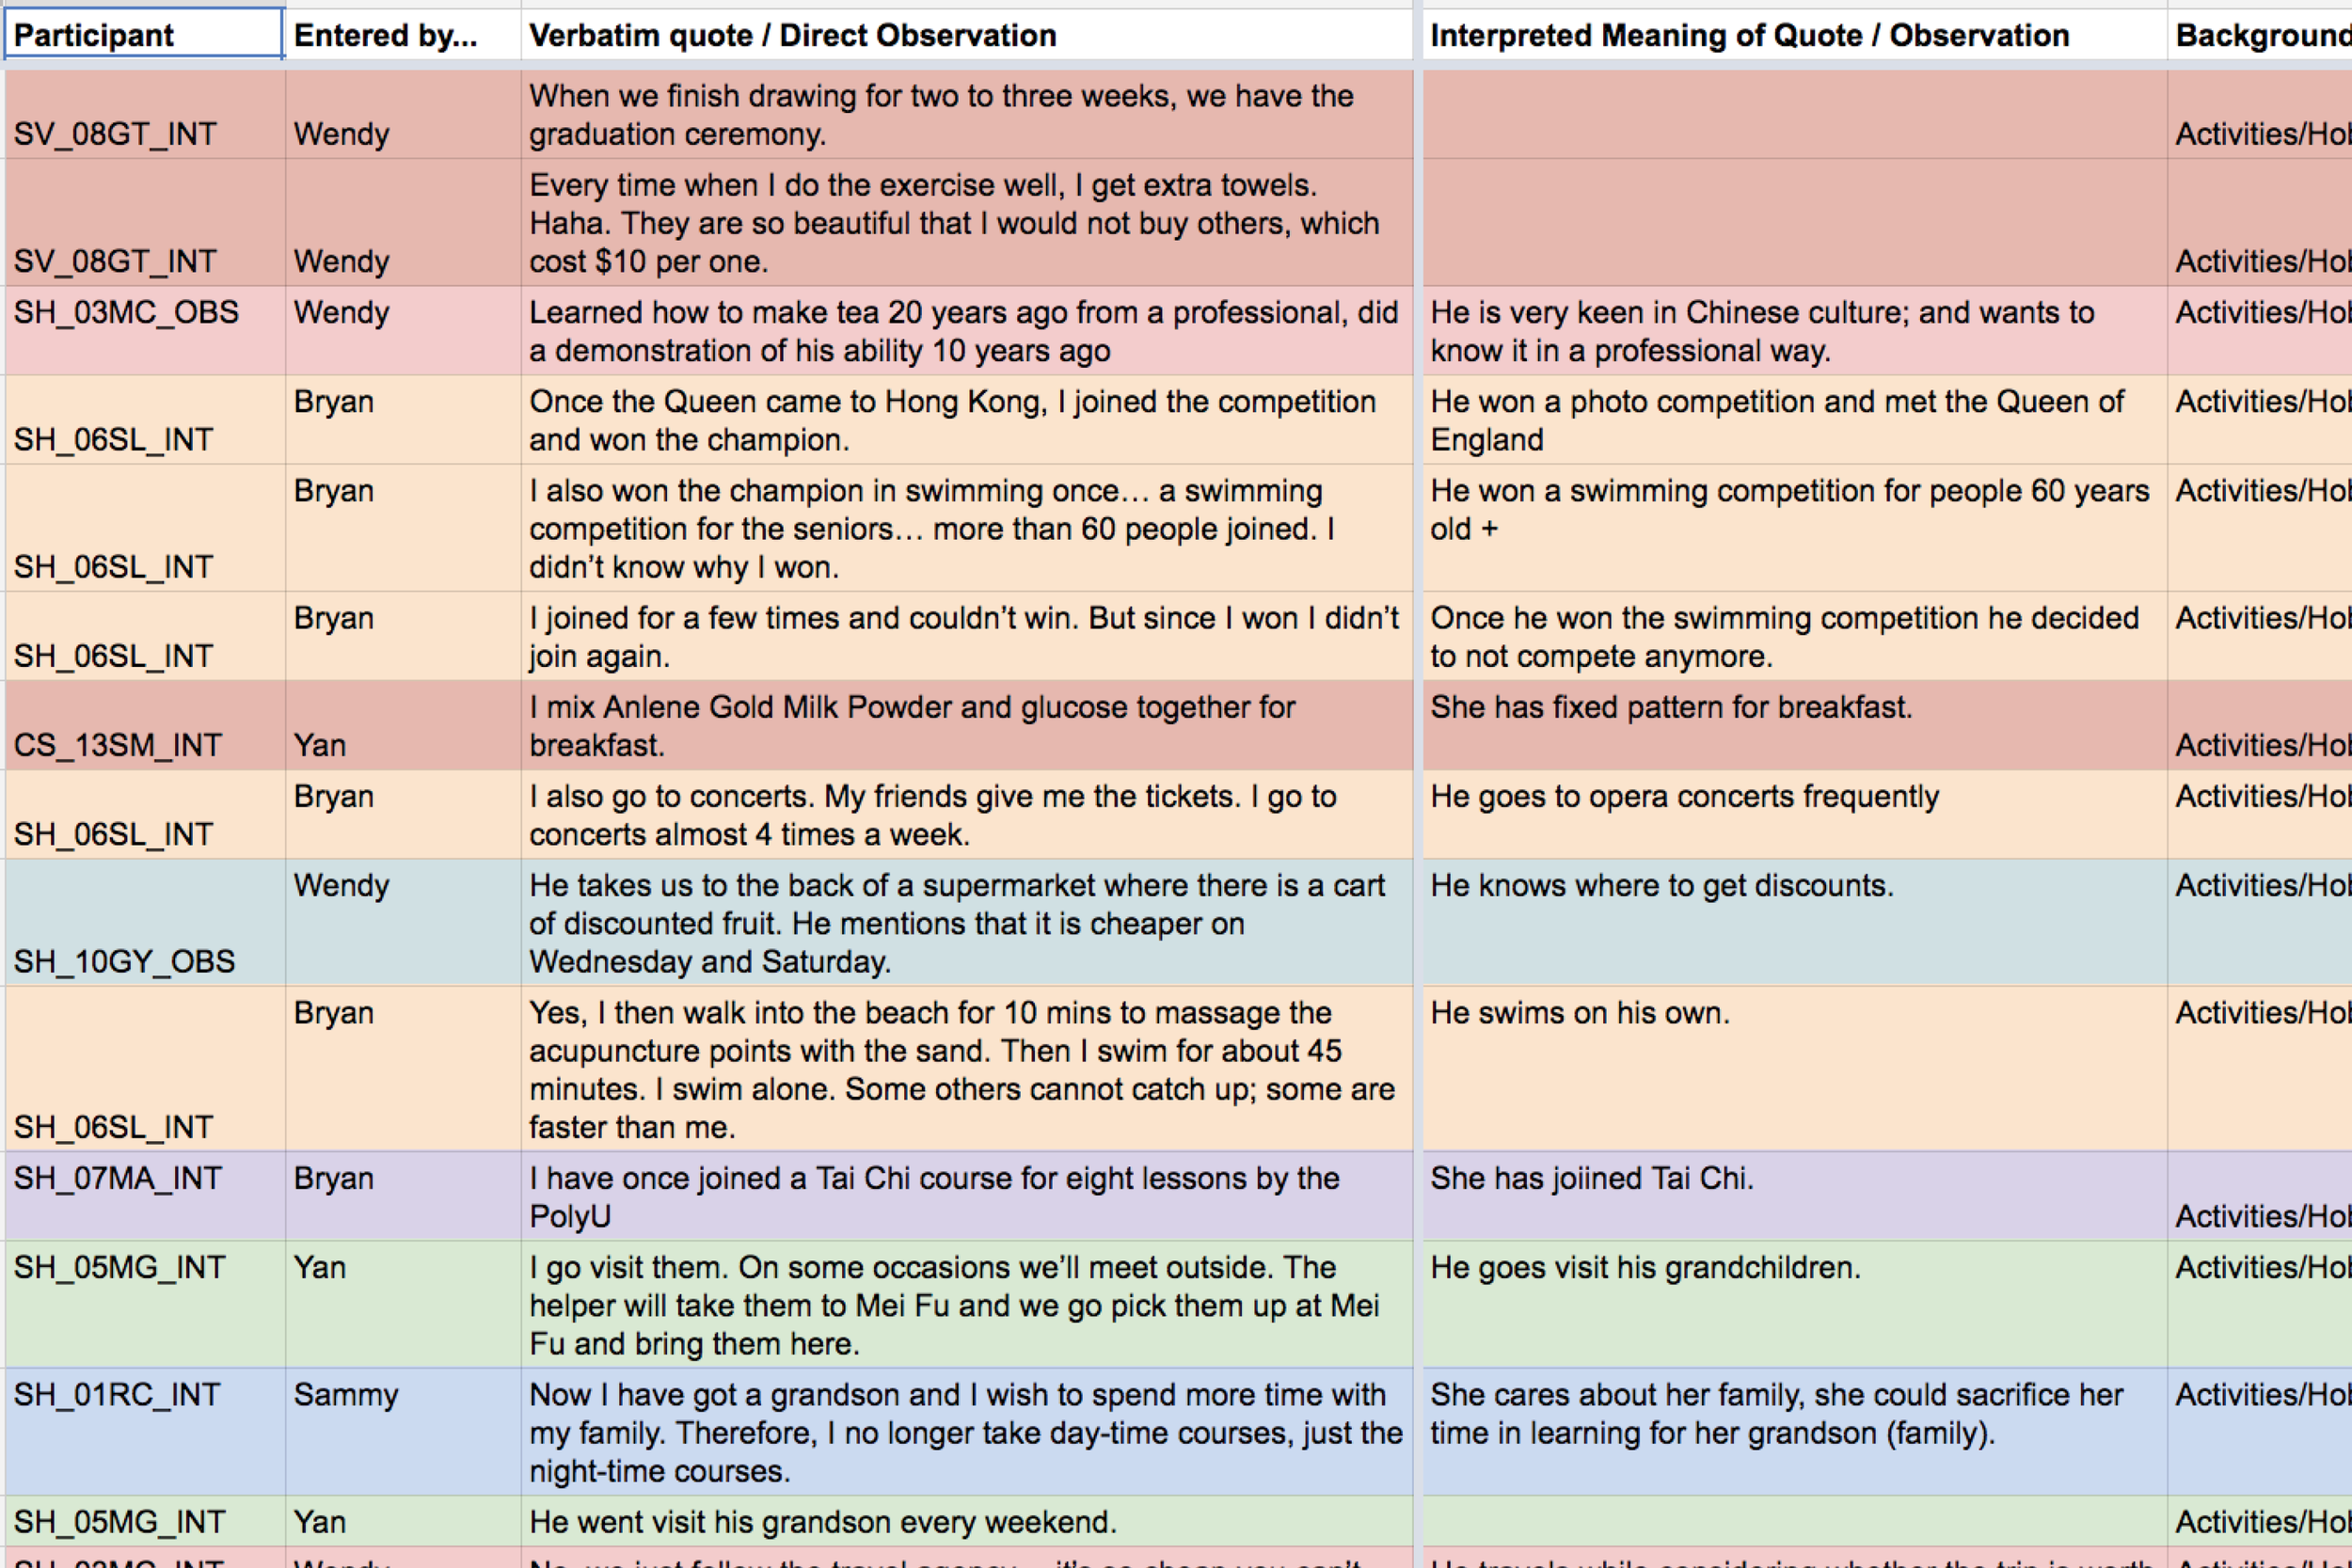
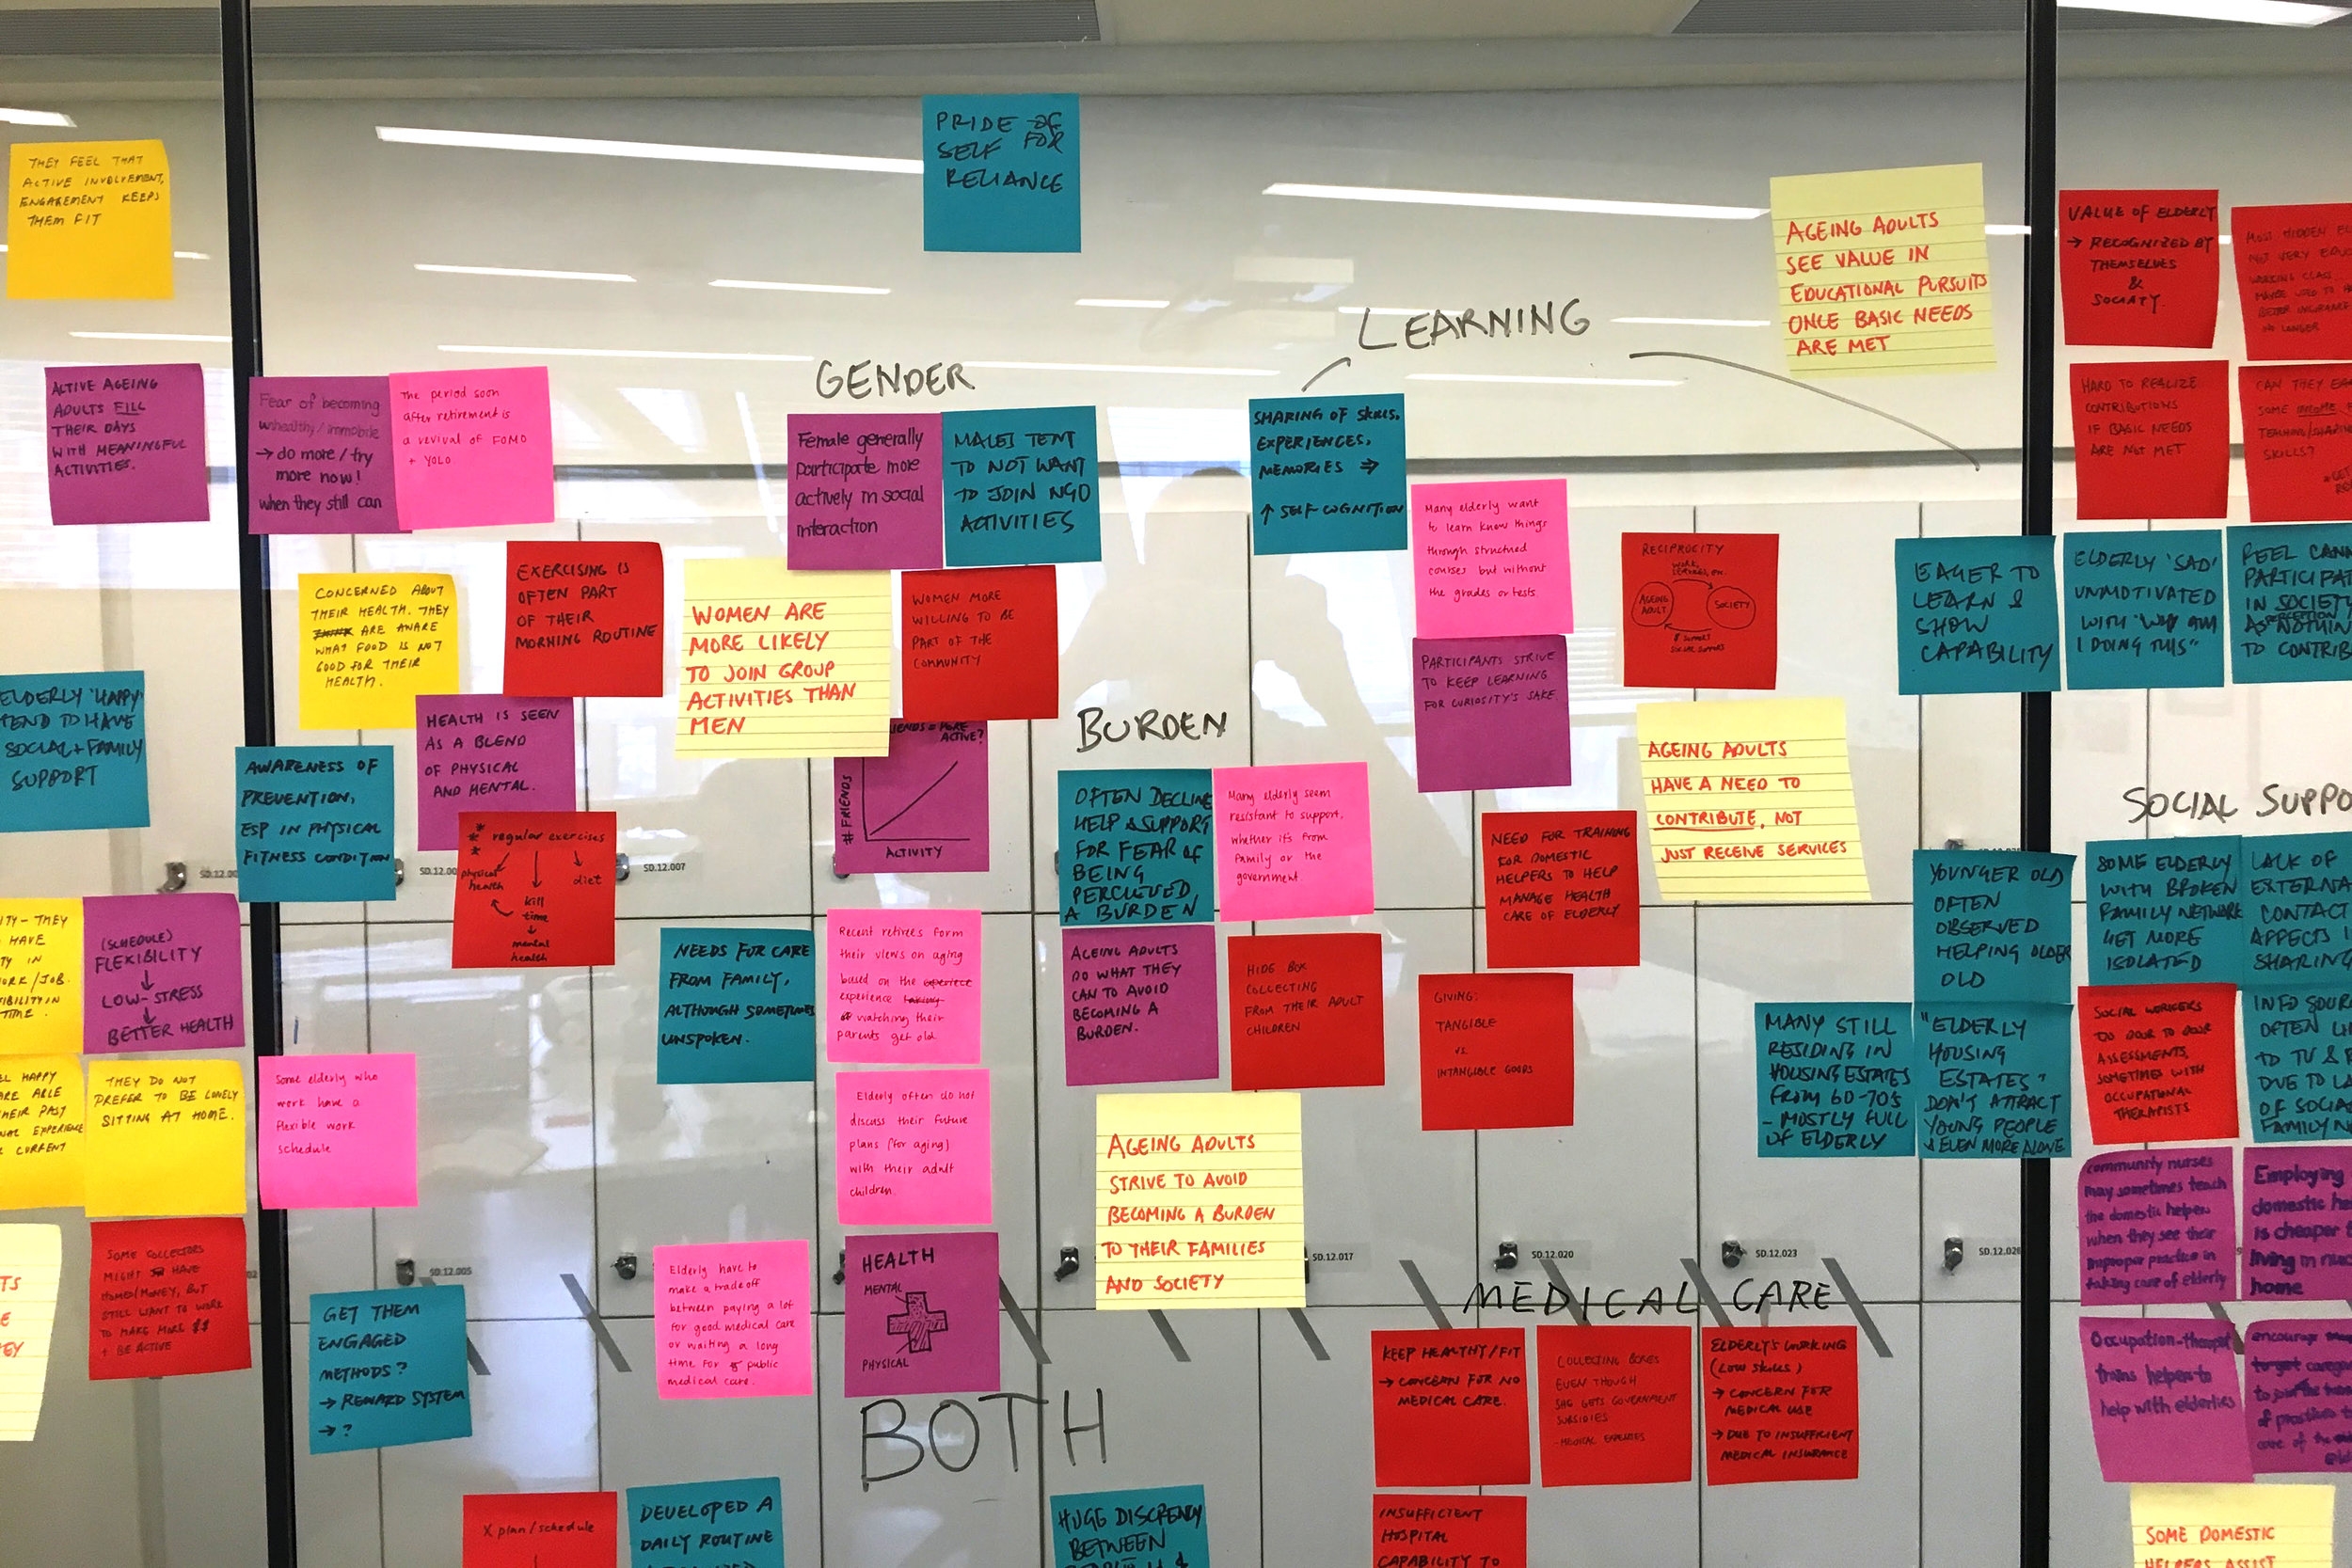
Analysis + Synthesis
We used the matrix to identify patterns and themes, which led to the creation of design principles and concept directions.

I managed the creation of an insight matrix, which captured relationships between patterns across all of our research activities.

I created and managed our database of all interview response and observation database, which needed to be well-documented after our summer project for future teams.

Anyone can put post-its on a wall, but ours were a result of site visit debriefs, which allowed us to quickly identify patterns to inform additional research and concept directions.


Research Planning

We created a bi-lingual document for camera study participants, which walked them through how to use the camera and the types of activities and objects to capture.

I developed an efficient research framework for researching communities in Mumbai. This allowed our team to rapidly analyze observations in a limited timeframe.

